Tracking Your Weight to Guarantee Weight Loss Targets
As the saying goes - 'There is nothing like a picture to tell the real story' This certainly applies to losing weight. To guarantee that you will lose weight you need a 'scare graph' - that is a graph of your weight each day compared with the target weight you have set yourself. If you see that you have stopped losing weight, the graph will 'scare' you into doing something to get back on your schedule.
It is astonishing that many weight loss programs, online tools and software systems do not include charts, and some of them are totally against displaying charts. Also many programs that have charts only have rudimentary ones that simply record your weight each day, or your total calorie intake, or your total calories burnt each day, but on separate graphs or displays, not simultaneously.
What you really need is a system that graphs that tracks your weight each day compared with your target weight, so that you can instantly see how you are going, and track the key aspects of your weight loss program. It should also include your calorie deficit (calories burnt less calories consumed). With this information you can make adjustments to keep on track and guarantee you will meet your targets.

What things should be displayed on your chart?
There are many options to choose from
- your daily weight,
- calorie intake via food,
- total calories expended by activity,
- your basal metabolic rate,
- workout and exercise details,
- food consumed,
- Body Mass Index (BMI), and many more
But, you will not want to be hampered by information that is too hard to compile, nor produce graphs that are too complicated and difficult to read and interpret.
So what are the essential things to include on your graph?
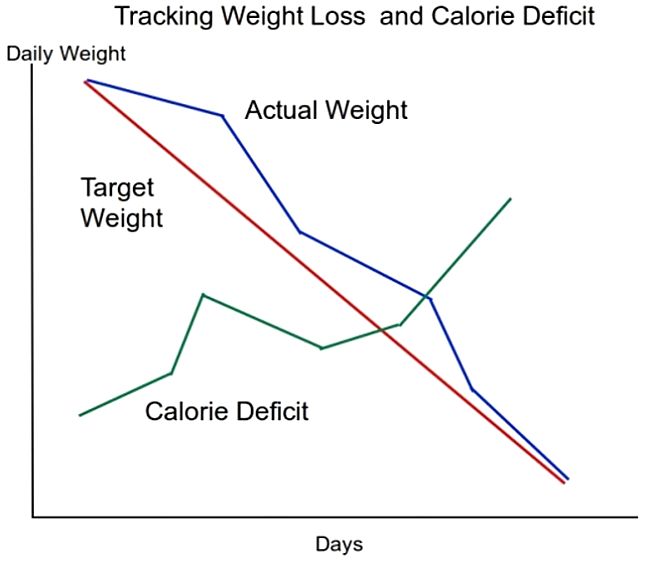
Ideally the program you use should calculate the following items automatically for you and plot them on a graph as shown in the figure. The three elements are:
- Your daily target weight - You should be able to enter your starting weight and your target weight loss rate into the program. For example, let's say you specify a weight loss goal of 2 pounds or one kilogram per week. The online program you use should calculate your target weight for each day based on this loss rate and your initial weight.
- Your measured weight each day
- Your Calorie Deficit - this is a very simple and basic concept. It is your calories burnt or expended, less the calories eaten in food. If you eat less calories in food than you burnt or work off through exercise and basic metabolism each day, your body will have to break down fat (hopefully) to make up the difference.
The concept of a calorie deficit is very simple - in order to lose weight you must being burning calories derived from fat. You must burn more calories than you take in through food.
If you have a positive calorie deficit you will lose weight.
If you have a negative deficit your weight will increase.
This is what you really need to know, especially in relation to your weight compared with your target weight.
Your weight loss monitoring program should calculate and plot this for you. The information you need to calculate this is:
Firstly the calories consumed by your body at rest. This is referred to as your Resting Metabolic Rate (RMR), which is the energy expended in maintaining your body temperature, keep your heart beating and blood circulating, respiring, digestion, tissue maintenance, etc. Your RMR is thus you rudimentary energy expended for your normal way of life when you are at rest (not exercising, walking etc.). You can find this information easily and it generally relates you your daily weight.
The second part of your calorie expenditure is the extra calories consumed through a diverse range of activities, such as walking, jogging, bike riding, running, aerobics, swimming, working out in the gym, etc. Your weight loss program should allow you to enter the exercise you have undertaken each day and calculate the total calories consumed.
Thirdly you need the total number of calories you consume each day.
The best way to display your calorie deficit on a graph is as a percentage of your RMR (as shown on the graph above). Usually you should aim for a calorie shortfall of about 10-20% of your RMR.
Looking at the figure shown above, you can see the benefits of displaying the three charts as an overlay.
It shows your weight loss progress compared with your target and it relates your loss rate to your calorie deficit.
If your weight tends to plateau, to level out, the response is obvious - your will have to eat less, exercise more and increase your calorie deficit to get your loss program back on track.
This relationship will tend to be an individual thing – something unique to your metabolism, lifestyle and exercise regime. You can also monitor what is working and not working in terms of calorie intake and consumption.
But you need to note that there will be a lag in weight change through both increased exercise and reduced food intake. This is why the chart display is so useful.
Conclusion
So to keep your weight loss program on track find a program that simultaneously displays your weight, your daily target weight and your net calorie deficit, as shown on the figure. Stick to it and you will be guaranteed to lose weight.